Interactive neutrino physics · Supernovae
What would a galactic supernova look like in neutrinos?
The neutrino burst of a core collapse in time and energy, and what three detector technologies would record at a distance you choose.
Educational visualization · configurable templates
A galactic supernova in neutrinos
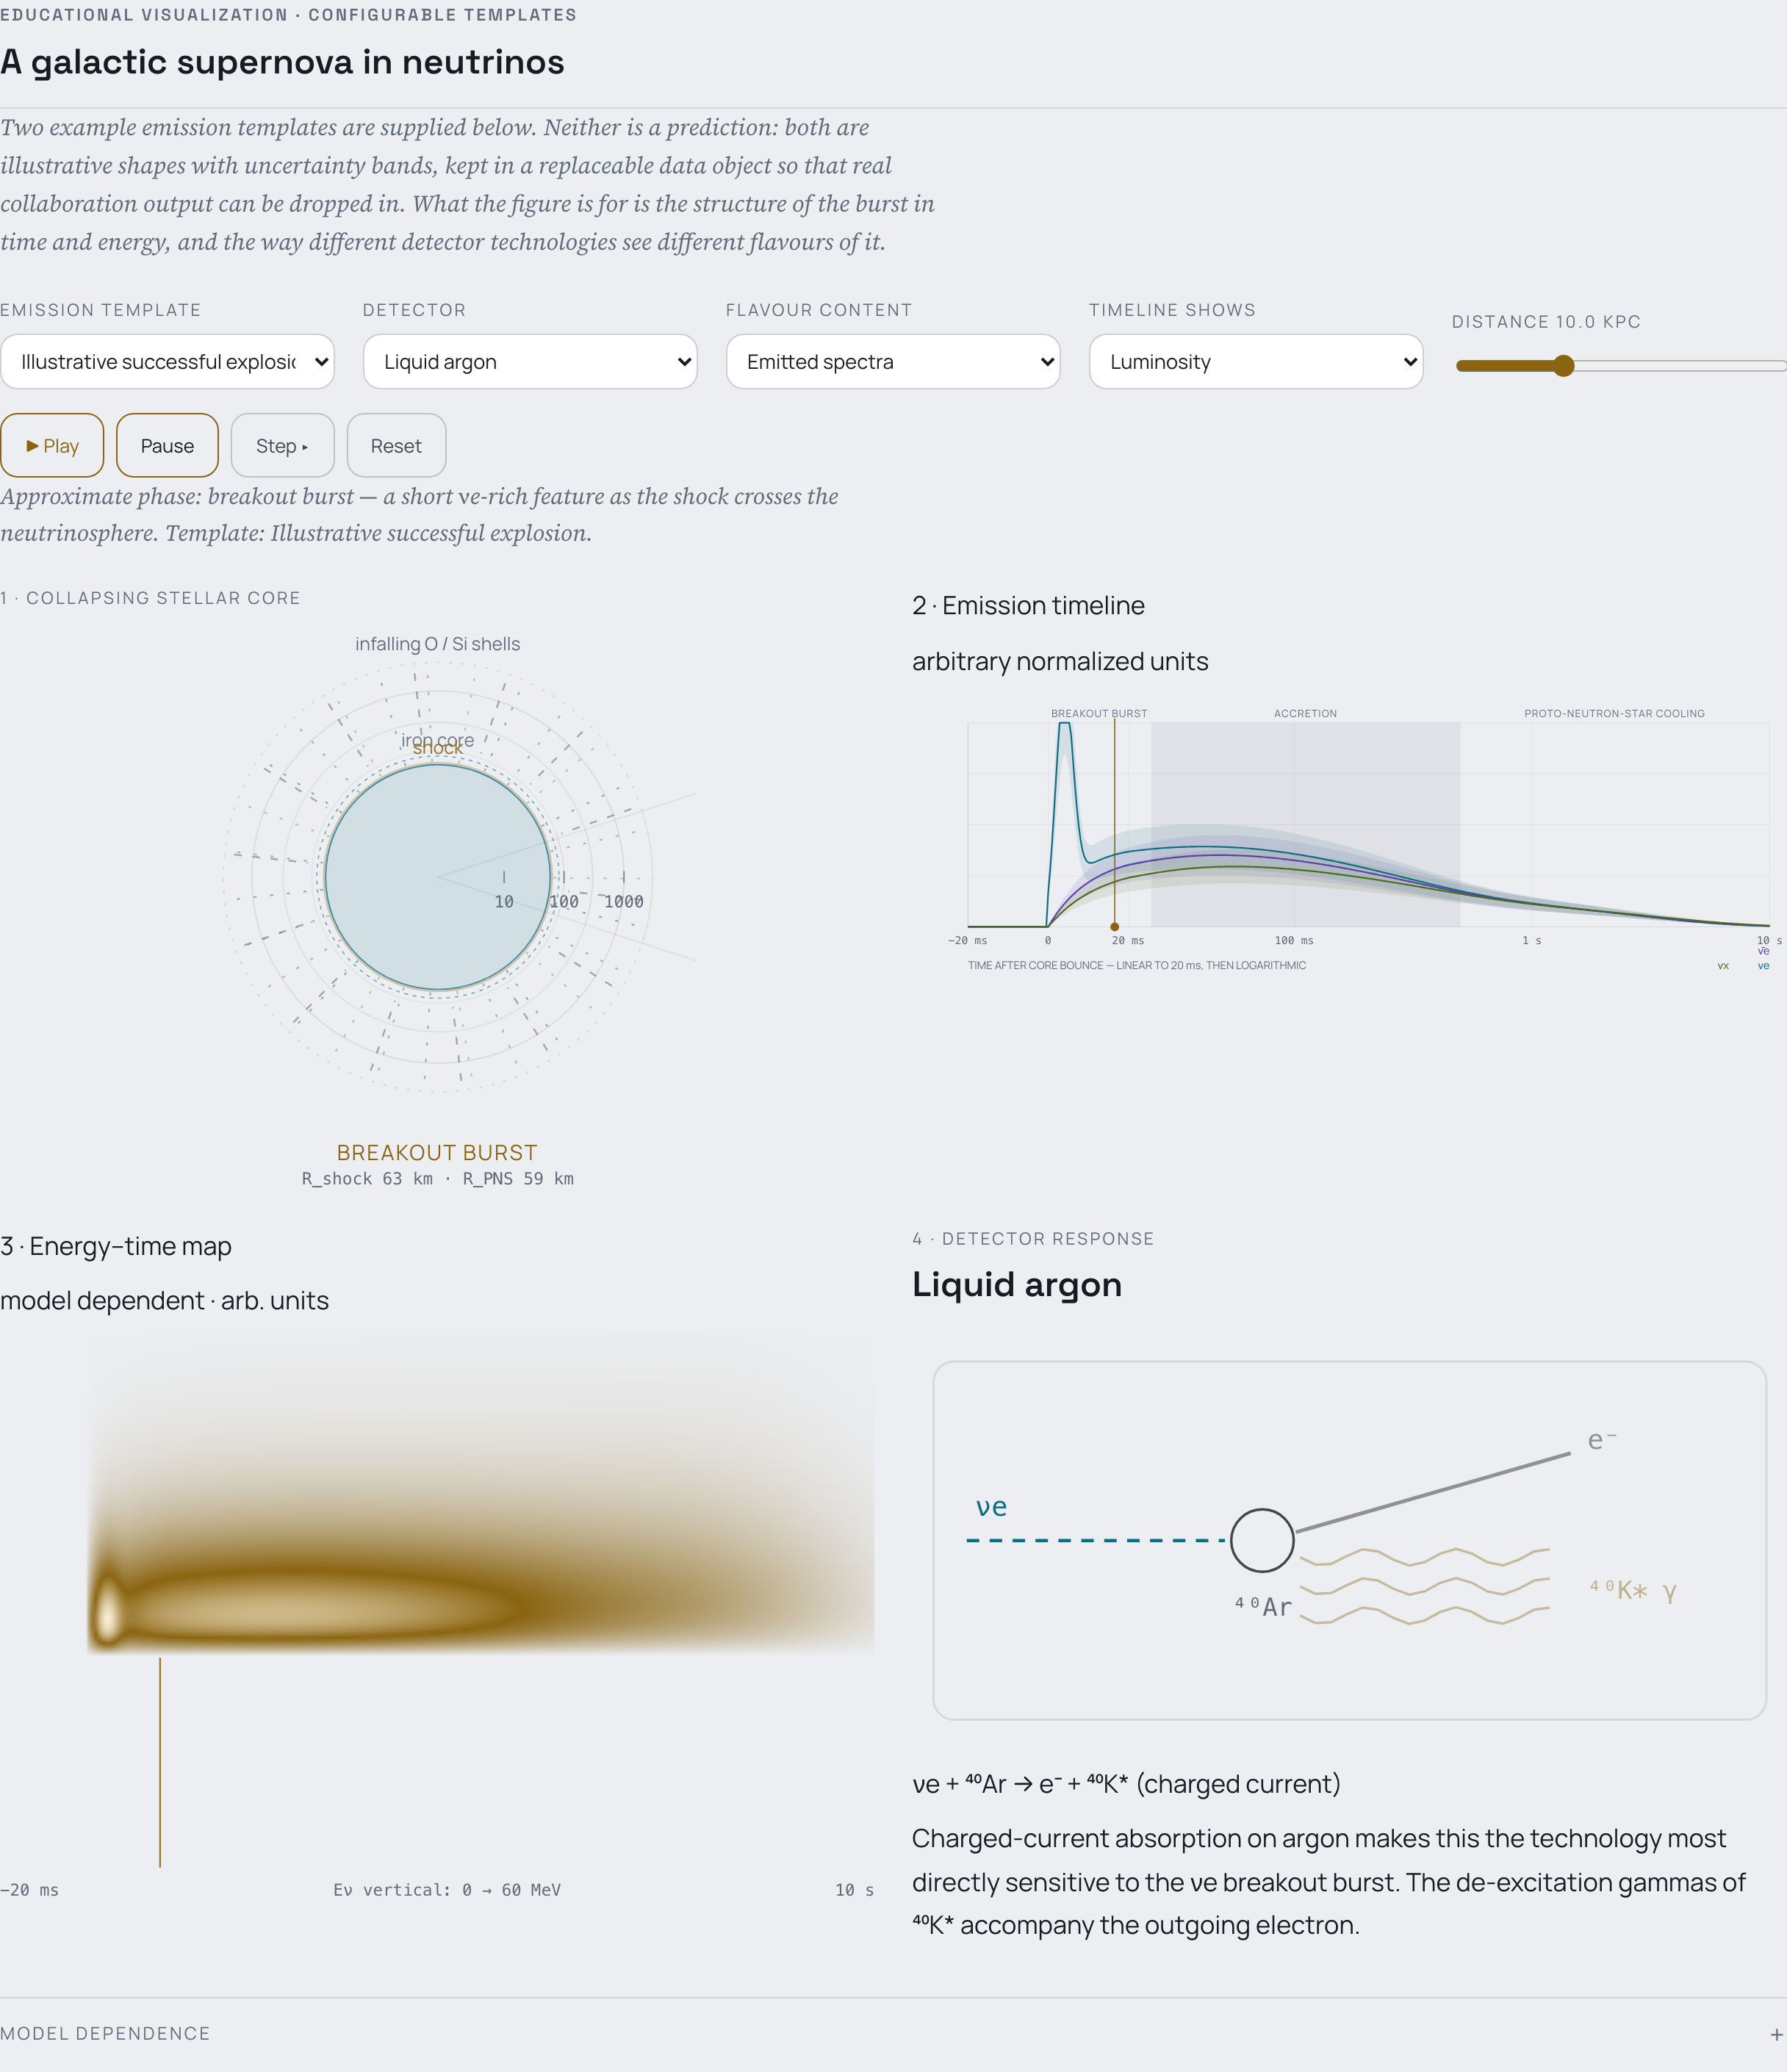
Two example emission templates are supplied below. Neither is a prediction: both are illustrative shapes with uncertainty bands, kept in a replaceable data object so that real collaboration output can be dropped in. What the figure is for is the structure of the burst in time and energy, and the way different detector technologies see different flavours of it.
—
1 · Collapsing stellar core
2 · Emission timeline
arbitrary normalized units
3 · Energy–time map
model dependent · arb. units
4 · Detector response
Liquid argon
—
—
- The two templates are illustrative shapes with uncertainty bands, not predictions. Progenitor mass, equation of state, rotation, the treatment of neutrino transport and the onset of explosion all change the luminosity and mean-energy histories.
- Phase boundaries are approximate. The breakout burst, the accretion phase and the cooling phase overlap, and their durations differ between simulations.
- Flavour conversion in a supernova is not settled. MSW resonances in the stellar envelope, collective neutrino–neutrino refraction, fast flavour instabilities, matter turbulence, shock passage and the unknown mass ordering can all reshape the flavour composition that arrives at Earth.
- νx here stands for the heavy-lepton flavours as a single effective species, as most templates report them.
- Event totals are deliberately not compared between technologies. That comparison is only meaningful once mass, target composition, threshold, efficiency, distance and channel cross sections are all specified; this figure fixes none of them.
- The 1/d² scaling is applied to the displayed relative rate. With normalized templates the vertical axis stays in arbitrary units; supply absolute fluences in the data object to obtain physical counts.
- Animation time is a reading pace. The horizontal axis is post-bounce time, but the playback rate is not real time.
About this figure
A galactic supernova in neutrinos
Level. Graduate: neutrino astrophysics.
Luminosities and mean energies of νe, ν̄e and νx from the breakout burst through accretion to the cooling of the proto-neutron star; a cut through the collapsing core with the shock and the neutrinosphere; and the events in liquid argon, water Cherenkov and liquid scintillator detectors.
Assumptions
- Two emission templates, both illustrative and with uncertainty bands: neither is a prediction. They sit in a replaceable data object so that collaboration output can be dropped in.
- Detector weights are relative within one technology; they do not allow totals to be compared between technologies.
- Phase windows are approximate, and the pace of the animation is unrelated to post-bounce time.
Where it fits
Cite and reuse
A. Marrone, A galactic supernova in neutrinos, interactive figure (2026), https://home.ba.infn.it/~marrone/interactive-supernova.html.
@misc{Marrone:supernova,
  author       = {Marrone, Antonio},
  title        = {A galactic supernova in neutrinos},
  howpublished = {Interactive figure, \url{https://home.ba.infn.it/~marrone/interactive-supernova.html}},
  year         = {2026}
}
Text and figures: CC BY 4.0. Code (assets/js/supernova.js): MIT licence. Use it in lectures and talks, adapt it, redistribute it — with attribution.